A new learning management system (LMS) platform is by no means a small investment. Yet many companies don’t take full advantage of the key metric reporting features that many LMSs come equipped with and provide the greatest return on the investment.
These LMS reports can help you measure:
- The successes and struggles of your learners
- The outcomes of the learning experiences you provide
- The return on investment (ROI) from your training courses
In this guide, you’ll learn why LMS metrics matter and why you should stick to them.
No vanity metrics here, thank you very much.
7 learning management system metrics to measure online training effectiveness
When a training program is done, most managers just want to know how many learners managed to pass the test at the end. While course completion is a useful metric, it’s far from the only one that matters.
Modern LMSs have reporting features that let you take a much deeper dive into the performance of your learning and development efforts. They help you leverage the so-called big data approach to statistics and analysis.
Let’s take a look at what they are.
1. Course completion rate and progress
While we did say they’re not the only LMS metrics to take heed of, course completion and progress are very important. After all, if your learners are not passing the final assessment, it’s safe to say they’re not absorbing and retaining the learning content.
But it’s not just pass-fail that you should worry about.
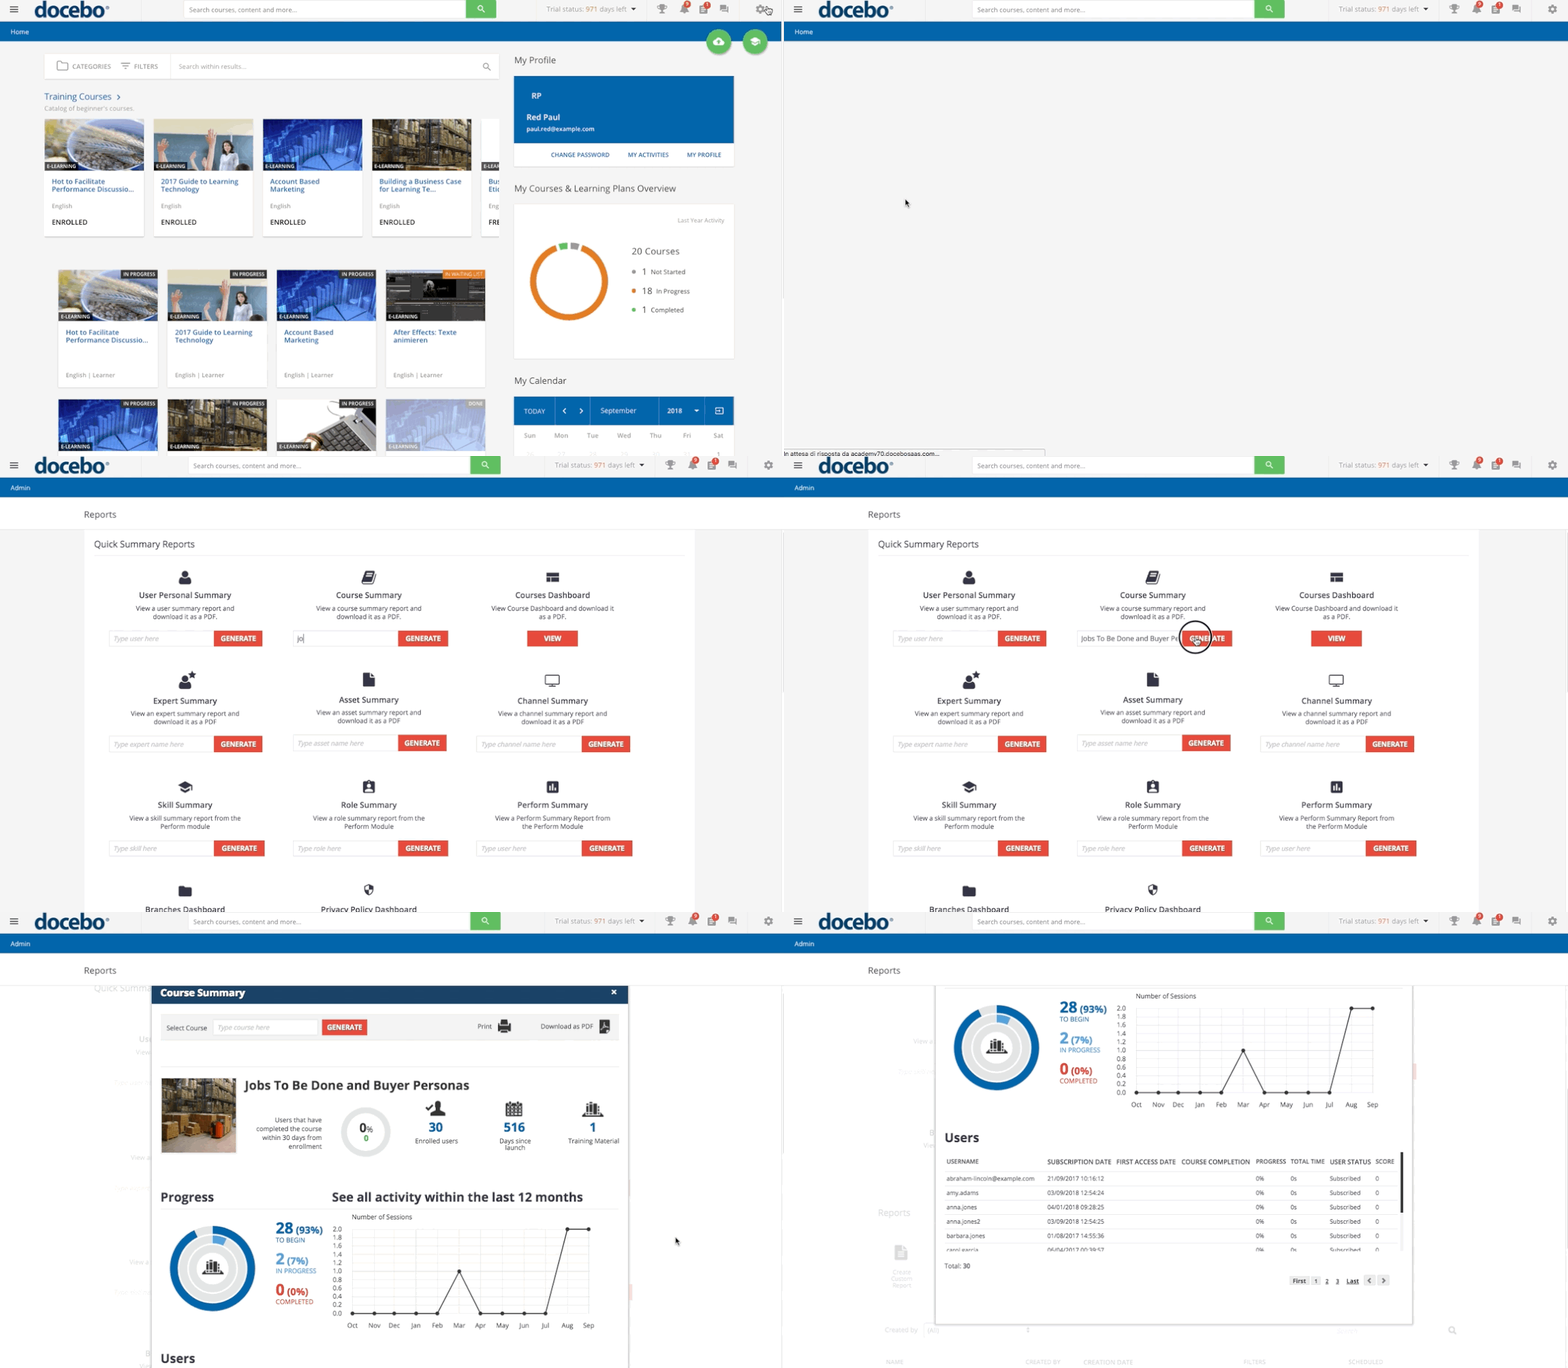
LMSs like Docebo show you the percentage of users who have begun the course, are in the midst of it, and have completed it. Additionally, as part of the report, you can see the percentage of learners who completed the course within 30 days of enrolment.
By analyzing these metrics, you can discover underperforming courses that are not engaging learners. Those would be the e-learning courses that either have a low completion rate or that learners are taking too long to complete.
On the other hand, if you notice that users are finishing a particular course too fast, it may be too easy. Giving your learners too many easy courses can cause boredom and low knowledge retention.
Tracking learner progress and course completion will let you optimize your learning content so it engages your learners and keeps them interested without becoming too challenging and frustrating.
2. Learner proficiency
The end goal for all instructional designers and managers alike is an increase in proficiency and competency. To see how well learners mastered the material, your LMS should be able to compare their knowledge levels before and after the learning experience. Most often, this comes in the form of e-learning assessments like multiple choice exams or simulations.
Good LMS platforms go a step beyond just reporting who passed and who failed. They also provide data on things like:
- Number of attempts a learner makes before passing a test
- Average scores for both passed and failed tests
- Amount of time it took learners to finish the test
The best thing is you don’t have to wait until the end of the entire course to put these learning metrics to use. Since the data is updated for each assessment and module, you can conduct learner proficiency spot-checks. If you notice that a lot of learners are struggling, you can offer supplemental material and lessons to help them.
On the other hand, if the data indicates a group of overachievers, you boost their knowledge even further by using your LMS’s social learning features to share further information in the form of articles or videos.
3. User engagement
The key to a successful training program is engagement. This is especially true for adult learners whose school days are long gone and who aren’t always inclined to learn something just because they’re told to.
Engagement ties into other important metrics such as knowledge retention, competency, and whether or not the learning objectives are achieved. If your learners are not engaged (low percentage of enrollment and completed courses) then you’re not getting your money’s worth.
Docebo calculates the engagement index based on the:
- Number of active and enrolled learners
- Number of times that a user accesses the platform and the number of actions they perform
- Percentage of completed courses
- Percentage of learners who self-enroll in courses
The final value of the index is then compared to the industry benchmark in your field so that you can make sense of the results.
4. Learner satisfaction
Evaluating any piece of e-learning content is difficult for instructional designers and learning and development personnel because they’re too close to the material. If you’ve worked long hours to produce the training courses, you’ll be too “in the thick of it” to be able to objectively assess your work.
That’s where LMS metrics can help.
Simply compose a survey or poll and let your learners have their say. Your learners are in the best position to give you good insights since they’ve just completed the course and their impressions are fresh.
Do your employees enjoy the training courses or are they finding them boring? Are the individual lessons too easy or too hard?
Would they recommend the e-learning courses they just took to coworkers?
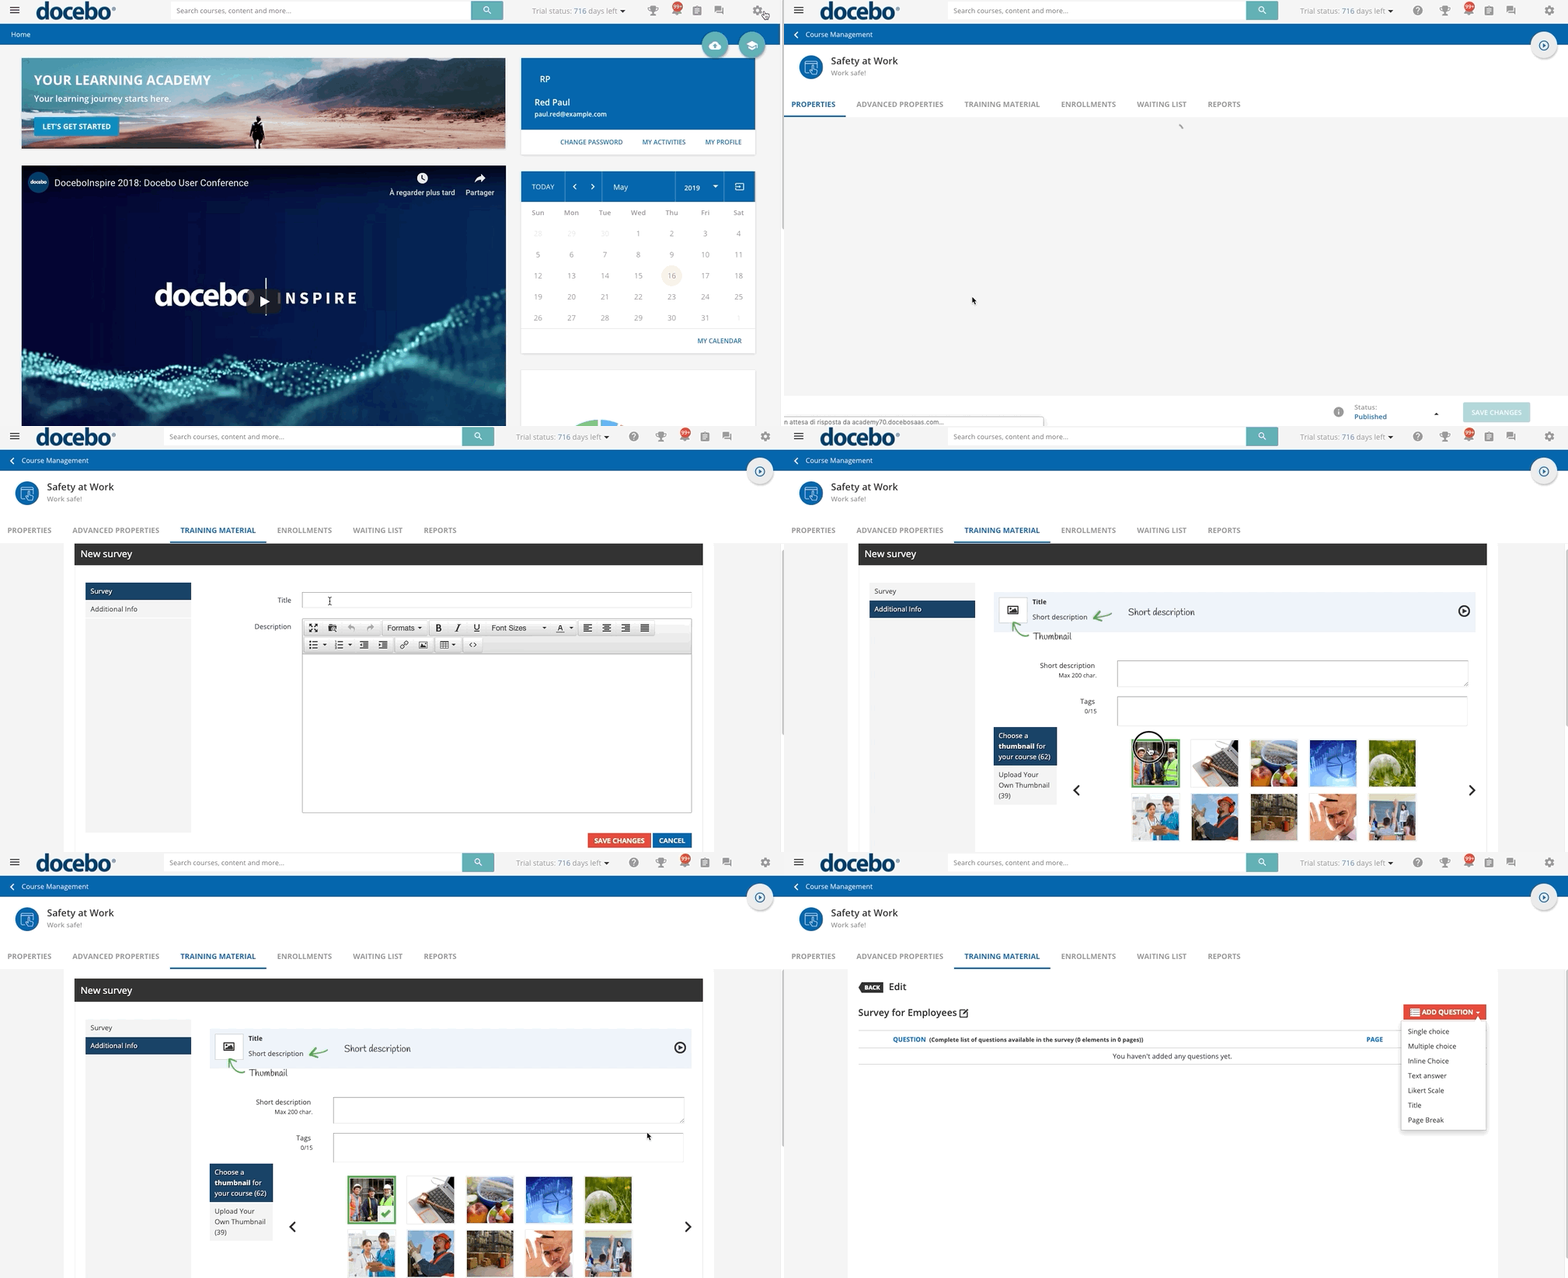
With Docebo, you can easily create a questionnaire that’ll provide the answers to these questions and see if your organization and its employees are making the most of the training opportunities offered.
5. Instructor and manager ratings
Your learners might love your e-learning content but think less highly of the instructors, managers, or supervisors facilitating the e-learning process. Facilitators have a key role in the learning experience and outcomes, so getting metrics on their performance is very important.
Whether it’s onboarding or compliance training, facilitators are the face of your organization in employee development. As with customer satisfaction, the best way to get data about their performance is to ask the learners.
Docebo’s learning impact feature lets you customize the evaluation process based on your needs and includes the option to enable instructor and manager evaluation. It comes with pre-built questionnaires so you don’t have to create a survey from scratch every time. Plus, it shows you the results with easy-to-understand graphs and dashboards.
6. Improved productivity
Ultimately, the driver behind all learning and development initiatives, be they webinars or training programs, is the need to achieve your business goals. Of course, you can’t achieve those goals without employee productivity and performance, so comparing pre-training and post-training KPIs (key performance indicators) is the way to go. This will determine if your training program translates into real-world improvements for your business.
To get the full picture, compare the metrics from your LMS with other insights, such as customer satisfaction and employee productivity, and see if there is a link. This, in turn, will tell you a lot about your e-learning ROI.
Simply put, training that doesn’t translate into improved productivity and increased KPIs is ineffective.
7. Course and assessment grades
Now, to the fun part that everyone loves: report cards and grades.
There has to be a way to know if learners have mastered something, and this is it. E-learning assessments give you insight into your employees’ knowledge base, skill development, and task mastery. Depending on how you phrase the questions in your tests (we’d recommend carefully and thoughtfully 😉), you have the opportunity to explore every aspect of learner performance, from comprehension to retention and real-world application.
Making the most out of e-learning assessments means choosing an LMS that has both qualitative and quantitative assessment capabilities.
- Quantitative assessments are all about numbers showing you the number of questions a learner got right and wrong.
- Qualitative assessment is based on performance reports from serious games or online training simulations.
Analyzing both kinds of assessment is a major part of training management and figuring out which parts of the e-learning course are effective and which are not.
How to effectively use LMS metrics and KPIs
Robust and comprehensive reporting and metrics are among the most important requirements when considering what LMS to use. But how do you use them properly and why do they matter in the first place?
Data you collect from LMS metrics can help reduce employee turnover, improve learner autonomy, and increase productivity. One of the most useful and practical applications of LMS metrics is understanding the skills of your learners. If a learner completes a gap-analysis evaluation, you can see exactly what they lack to perform their role as effectively as possible. You can use this skill-gap data to build personalized employee development plans that’ll fill the knowledge gaps and improve employee skills and productivity.
Metrics can also improve learning content. For instance, if you see that learners are skipping through certain pages of an e-learning course, you can find ways to make them pause to read and retain the information. This could be achieved by adding more interactivity on these pages or activities that require learners to analyze and apply the information.
Overall, LMS metrics are key to discovering the link between learning and organizational performance. Without these metrics, you’d have no way of knowing if your training efforts are yielding real-world results.
Vanity metrics vs. actionable metrics
Vanity metrics are numbers that are essentially futile when it comes to determining areas of improvement or reaching positive business outcomes. These are metrics that might look nice on your company’s social media. Like “99% of our employees have a certification in intergenerational conflict resolution.” One of the most common vanity metrics is course completion. Managers and leadership like to see a high number. However, the fact that someone completed an e-learning course and passed the test doesn’t tell you if they enjoyed the learning experience or if they retained the knowledge.
The opposite of vanity metrics—and what you should strive to draw from your LMS—are known as actionable metrics. Actionable metrics are data that will provide you with valuable insights that can inform and improve your learning strategy. Finding and tracking actionable metrics will let you spend less time on unproductive and ineffective activities and more time doing things that drive engagement and business results.
Now, we need to stress that every company and industry is different, so the metrics that are vanity to one organization may be invaluable to another. In general, actionable metrics will answer one of these questions:
- How does this data direct me to take a specific action?
- What does this information tell me about how learning is impacting my employees, customers, partners, etc.?
- Does this information help me link learning to organizational performance?
Now over to you
To know if your learning and development efforts have a real-world impact, you need metrics. And not just any old metrics, but metrics that are exact and actionable. That way, you’ll connect learning to organizational success and know if your investment in an LMS is justified.
Docebo is equipped with many different metrics and reports that will help you judge how effective learning is in your organization. See how it all works in practice and schedule a live demo with Docebo now.


