Prove the impact of learning: Collecting, analyzing, and interpreting insights

The #1
greatest challenge faced by L&D teams is measuring the effectiveness of learning[1]
42% of organizations
have no strategy or standardized approach for learning measurement[2]

Measurement is critical
If an organization measures the impact of learning, it says a lot about them. Specifically, it says that they’re 3x more likely to have strong growth, retention, and profitability[3].
Focusing on learning has a huge impact on organizational performance.
Despite this, L&D professionals’ belief that their leaders see the value of learning has decreased sharply, from 81% in 2021 to just 67% in 2023[4].
The solution is a better, stronger data practice that proves the impact of learning—and gives you the insights you need to improve it over time.
This resource won’t singlehandedly get a world-class data practice up and running for you. But it will change the way you think about proving learning impact and share some useful frames and best practices.
Thinking about metrics (and why it matters)
Small shifts can make a big impact
When people talk about learning data, what they usually care about are learning insights. Here’s the difference:
Raw data is singular and siloed. It’s a fact. For example, a piece of raw data would be: “Our sales in Q3 were $1,300,000.” Without additional context, it’s hard to tell if that’s good, bad, improving, worsening, etc. Raw data is the base for all metrics, including sales numbers, customer demographics, individual survey responses, web traffic, etc. And it usually comes from a tool—like a software platform, a survey, or a spreadsheet.
Think of raw data like a single puzzle piece: Looking at just one piece, it’s hard to glean much information about the bigger puzzle. You can’t tell where the piece fits, what it means, or even what picture it’s a part of.
Insights are the valuable patterns, trends, relationships, and conclusions drawn from data. To return to the sales example (Q3 sales of $1,300,000), insights would help you plan for the future. A useful insight might be looking at the most profitable customer segments that led to that performance and shifting your marketing focus more towards those segments.
Simply, data tells you what is. Insights tell you what it means and what to do next.
L&D insight excellence isn’t just possible. It’s attainable.
Most organizations are only at the point where they’re looking at very superficial data like enrollments and course completions. But so much more is possible. Imagine being able to answer questions like this:
- Customers who take this course have a 30% higher renewal rate and their contract value is 11% higher. How can we get more customers to take this course?
- To roll out a new IT Security compliance course to a European audience in the Retail industry, what format and course duration is best to optimize completion rate?
- Skill domain analysis: Do I have robust training content for the skills I’m looking to build in my organization?
Getting to this level might seem intimidating, or even impossible. But it’s easier than you think (we promise). And it can be done by ordinary L&D teams who are extremely busy and don’t have degrees in data science. Let’s show you how.

Tip 1: Focus on leading indicators
Old habits can be hard to break and using lagging indicators (instead of leading indicators) is the oldest habit of all.
What’s the difference?
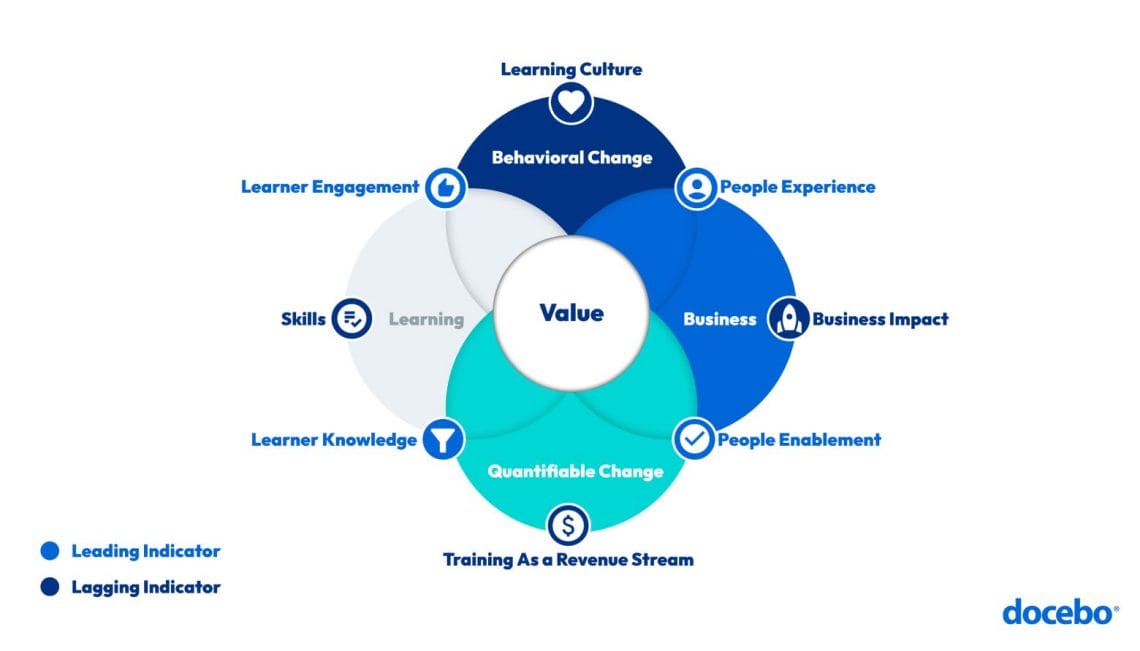
Lagging indicators are like an echo; they happen after the thing that caused them. The classic lagging indicator is revenue growth. A business can launch a new product, marketing campaign, or sales strategy and their success is determined by whether or not revenue grows afterwards. A lagging indicator of success.
Leading indicators get less publicity, but they are deeply powerful. They happen before something else, giving them predictive power. For example, great leading indicators of revenue growth are things like inbound sales volume and customer satisfaction.
When proving the impact of learning, focus on leading indicators like employee performance and customer engagement.
Tip #2: New to measurement? Start small
The best way to succeed is to begin
The best time to kick off a learning measurement practice isn’t when you have the perfect three-year strategic plan and tech stack. The best time is now. Here’s how to start:
First, pick a use case that fits these three criteria: It’s highly relevant to your business, it has well-defined stakeholders, and you already collect metrics around it. Sales Enablement would be an excellent choice. It’s relevant and most organizations have data about sales performance (like quota attainment and pipeline). Onboarding might be a harder use case to work with, especially if you’re among the 55% of business that don’t measure onboarding effectiveness[5].
For our example, let’s use Customer Education. Your organization likely already collects data around average contract value (ACV), and renewal rates. While these are lagging indicators, they’re a good place to start.
Since you have business data and learning data, you can combine that data to discover insights!
You could divide customers into two groups: Those who are engaged with your customer education program and those who aren’t. Then, compare those groups on renewals, ACV, NPS, support tickets, etc. This won’t give you a perfect picture, but it will be incredibly informative. And it’s likely to show you that customers who engage with learning stay longer, spend more, and are more likely to advocate for your brand.
You could also run an analysis to understand the factors that influence learning engagement. Look at any differences that appear based on region, industry, team, size, and other variables. Plus, you should look for trends in your own internal teams: Do you have any standout performers? if so, you’ve identified an upskilling and knowledge-sharing opportunity. Talk to those teams about what they’re doing and capture those insights into a new learning resource.
Of course, we’ve glossed over a very critical part of the process. It’s easy to say “Combine that data to discover insights,” but for most businesses, it isn’t that simple. And without the right tools and technology, it can be challenging. That’s why use cases like customer education and sales enablement are great to start with. In an afternoon, you can pull the learning and business data from 50 customers and look for correlations. Of course, with the right technology (like using Docebo Learn Data + your Business Intelligence tool) you can make it much easier.


Tip 3: Ensure accountability with these questions
Use these questions to check your L&D team’s understanding of measurement and readiness for change:
- Does our L&D function understand our organization’s top three priorities?
- How can we connect the learning metrics we have with key business outcomes using leading and lagging indicators?
- How well do other parts of the business understand L&D and how can we enable them? (No, SCORM isn’t a Star Trek villain…)
- Who’s in charge of analyzing data? Making changes? How often?
- What should trigger an action? Is there an alert system for these conditions?
Tip 4: It’s a marathon, not a sprint
Think incrementally. Change exponentially.
You don’t need to be a math genius or a computer scientist to agree: Data is exciting. It can validate your theories and challenge your assumptions. In many ways, thinking with data is a way of being. An orientation. A culture.
It’s a culture that takes time to build. Especially in teams that aren’t used to it. So, commit to being on this journey for the long haul. And follow these tips:
- Upskill your team in data tools and statistical thinking. It will help you ask better questions, build better programs, and feel more comfortable and confident. Plus, it’s fun!
- Prove that you improve. Get some quick wins and celebrate them widely. The fact is, many people don’t see L&D as a data-driven function. But you can help correct this. Select some learning metrics that highlight the performance of your programs and show how you’ve measured and improved them. Then, shout it from the rooftops: Put an interesting insight into a presentation or use it to inform a new strategy. After all, what good is having explanatory power if it doesn’t impact your behaviour?
- Think incrementally. As with most things, consistent improvement wins. Every time you go digging for new insights, try to make the process 1% better in some way. And don’t neglect the human element: Making connections with stakeholders from other parts of the business is also incredibly valuable.
Everyone knows that learning is powerful and that it can help solve the most pressing business challenges. Skill gaps, talent retention, sales performance, and customer education are all pressing issues that learning can influence.
Most learning programs are impacting those challenges. The problem is proving it. And a lack of proof is causing business leaders to lose faith.
A robust data and insights practice is the solution. Your learning program is having an impact. It’s time to measure it, prove it, and make it even more effective.
Conclusion
To succeed and grow, You need Raw data and Insights
We hope this has been an interesting and informative walk through the world of learning measurement. These concepts are all deeply important for any successful measurement program:
- The difference between data and insights
- The difference between leading and lagging indicators
- Good use cases to focus on at the start of your measurement journey
- Questions to ask your team and yourself
We want to reiterate:
You can do measurement, analytics, and insight better than you’re doing it now—without having to transform your team or the way you work.
But if you want to make it easier with the industry’s best technology, we have simple and intuitive solutions that can help:
Learning Impact is designed to help you analyze and improve learner engagement. It gives you juicy, qualitative data about how learners respond to your training, plus metrics on the effectiveness of your learning programs and how they impact people experience and performance.
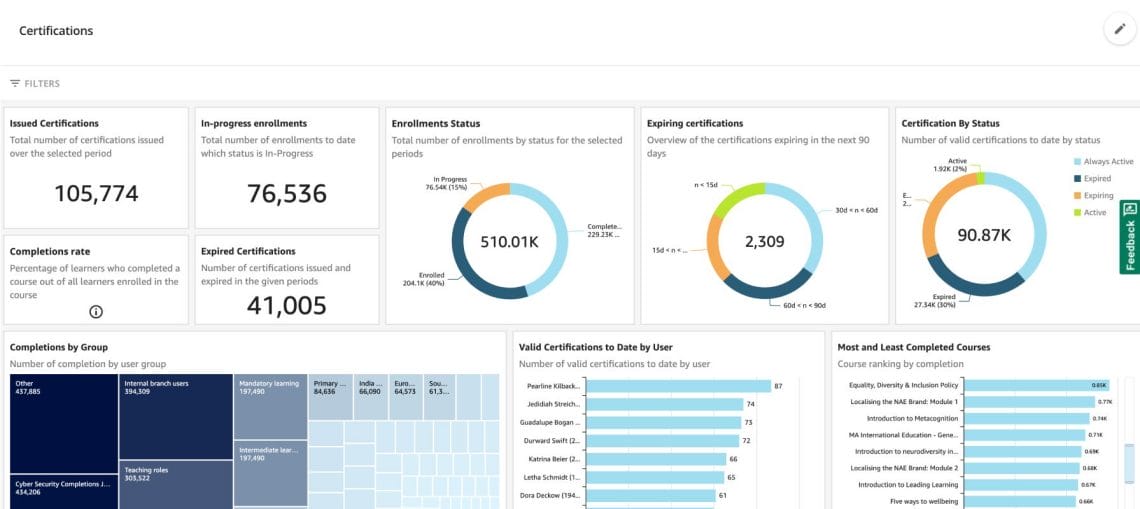
Insights will make you look like a data genius even if you never liked math. It lets you select the metrics that matter to you and then displays valuable insights in a simple and intuitive dashboard. A click here, a click there, and voila: Beautiful data visualizations.
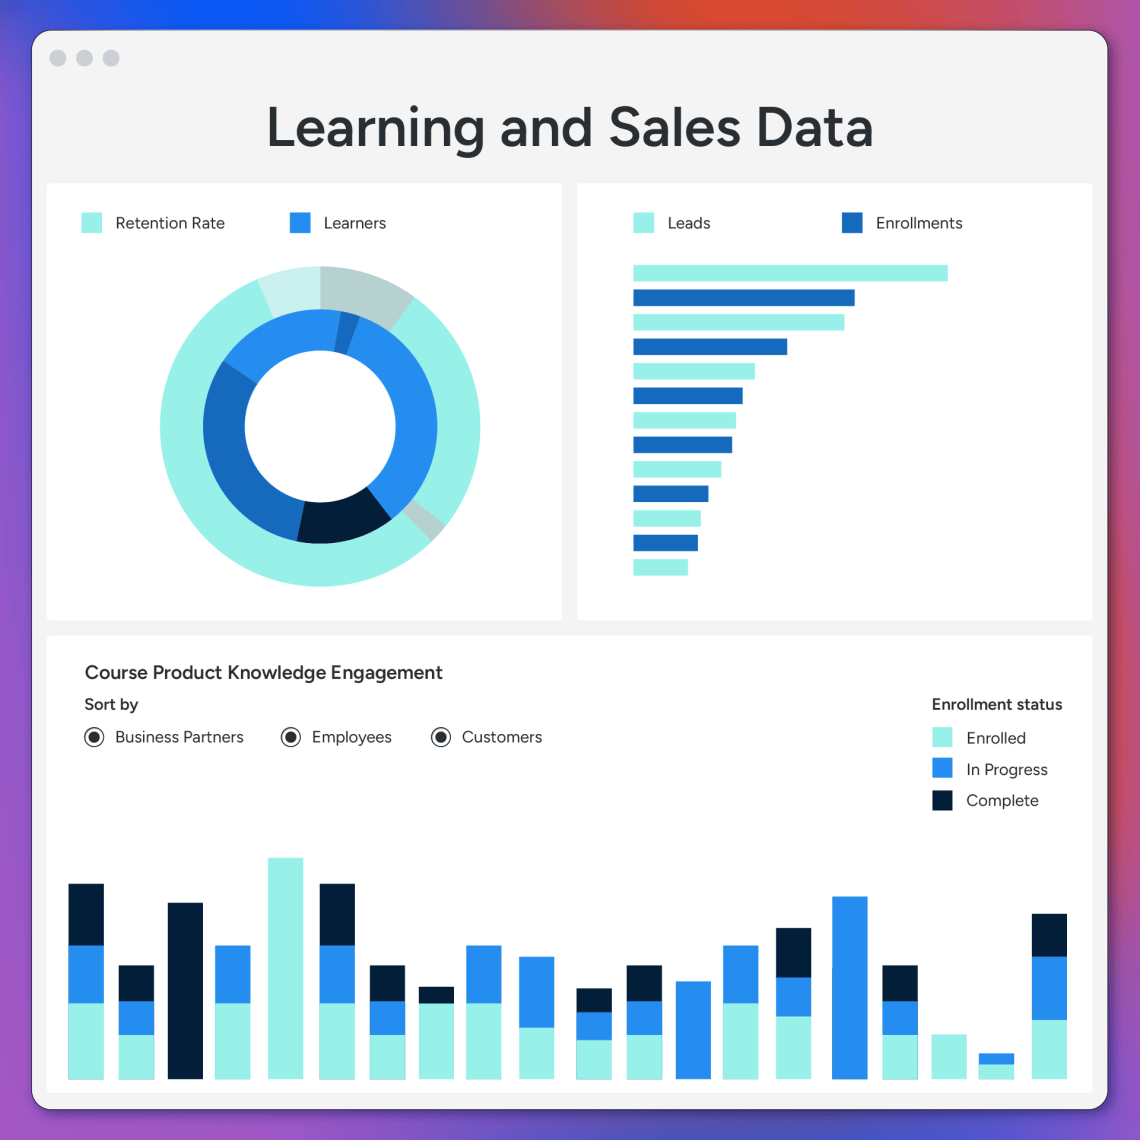
Finally, Learn Data lets you export clean, organized, and high quality learning data and bring it directly into your own Business Intelligence tool. This empowers sophisticated organizations to see connections and correlations between metrics collected from different parts of the business, like learning and sales.
And of course, Impact, Insights, and Data are optimized to be easy-to-use and to elevate the performance of your organization, your team, and you. What data really gives you is confidence. Confidence that you’re making the right choices, confidence in the future, and confidence to improve every day.
So, whether you do it yourself or do it with Docebo, we hope you prove the impact of learning. Your learning programs are making a difference—and it’s time everyone knew it.

